Closing the OEE Visibility Gap with Performance Reason Coding: Turning Speed Loss into Actionable Insight
Most manufacturers have solid visibility into two pillars of OEE — Availability and Quality. But Performance losses, the difference between ideal and actual production speed, often slip through the cracks. That’s why Kanoa Ops introduced Performance Reason Coding — a structured framework to capture and analyze speed losses, closing the OEE visibility gap.
Understanding the Missing Link in OEE
OEE is made up of three core metrics:
- Availability – Are we running when we should be?
- Performance – Are we running as fast as we should be?
- Quality – Are we producing good parts at that speed?
Most plants can point to a handful of big downtime events to explain availability losses and track scrap to account for quality losses. But what about when a machine runs at 80% of its ideal rate for hours, or when throughput is deliberately capped because upstream material isn’t arriving fast enough? These losses often sit in the “noise” layer of OEE — visible as reduced performance but without structured data behind them.
Until now, MES systems have offered little more than basic throughput metrics but rarely provide context: why performance was reduced and how much time was lost. That means little to analyze, and little to act on.
With Performance Reason Coding in Kanoa Ops, speed-loss events become structured, traceable data: codified, linked to assets and items, and reportable via dashboards.
What Performance Reason Coding Is (And How It Works)
Performance Reason Coding is Kanoa Ops’ framework for capturing the why behind speed losses. It allows teams to define and track specific Performance Events — the moments when production runs slower than ideal — and assign a reason code to each one.
Examples include:
- Material Flow Constraint
- Operator Adjustment
- Tool Wear
- Machine Warm-Up Period
- Reduced Speed for Quality
These codes transform ambiguous “slow cycles” into structured, analyzable data points.
Key Concepts
- Performance States: Introduced in v1.11, these are reason codes for speed loss.
- Performance Reason State Classes: Group states into logical classes, like “Material Constraint” (with states such as “Low Infeed” or “Late Delivery”).
- Performance Events: Logged occurrences where a performance state is applied, either manually or automatically, capturing time lost, asset, item, work order, and more.
- Dashboard Widgets & Analytics: Out-of-the-box widgets introduced in v1.11 make it easy to build dashboards and visualize performance losses across assets or shifts.
Implementation Highlights
- Asset/Item Linking: Link performance states to specific assets and items, so operator selections remain contextual and relevant.
- Manual & Programmatic Logging: Operators can log events via built-in entry screens. For automated setups, engineers can use
system.kanoa.event.addPerformanceEvent()to record events from PLCs or Ignition scripts. - API & System Functions: Configure and manage states and events with functions like
system.kanoa.performanceState.addPerformanceState,addPerformanceStateClass,getPerformanceEvents, and more. - Analytics Bound to Production Runs: Events are tied to specific production runs, ensuring reports reflect actual operational performance.
Why This Feature Delivers Real Value
1. Quantify Hidden Losses
By tracking when a line runs below its ideal rate and capturing why, vague “slow cycles” become measurable. You can now aggregate data — how many minutes or hours are lost per asset, per shift, due to specific performance reasons.
2. Enable Root-Cause Analysis
With reason codes tied to assets, items, and shifts, you can pinpoint recurring bottlenecks. Which assets suffer most from “Material Flow Constraint”? Do slowdowns correlate with certain products or shifts? The dashboard widgets reveal these patterns instantly.
3. Close the OEE Loop
The full OEE picture includes three pillars:
- Availability – tracked via downtime events
- Quality – tracked via scrap and item states
- Performance – tracked via performance reasons
With all three in place, your OEE data evolves from descriptive to actionable.
4. Drive Continuous Improvement
When speed-loss events are visible and quantified, improvement becomes possible. Whether through operator training, material-flow balancing, or equipment optimization, teams can act on data-driven evidence, not intuition.
5. Increase Operator Engagement & Data Trust
By giving operators contextual, asset-linked reason codes and transparent dashboards, data becomes something they trust and use. They don’t just see “performance down” — they see “performance down due to Low Infeed”, backed by real data.
How to Get Started with Performance Reason Coding
Step 1: Define Your Performance Reason Classes and States
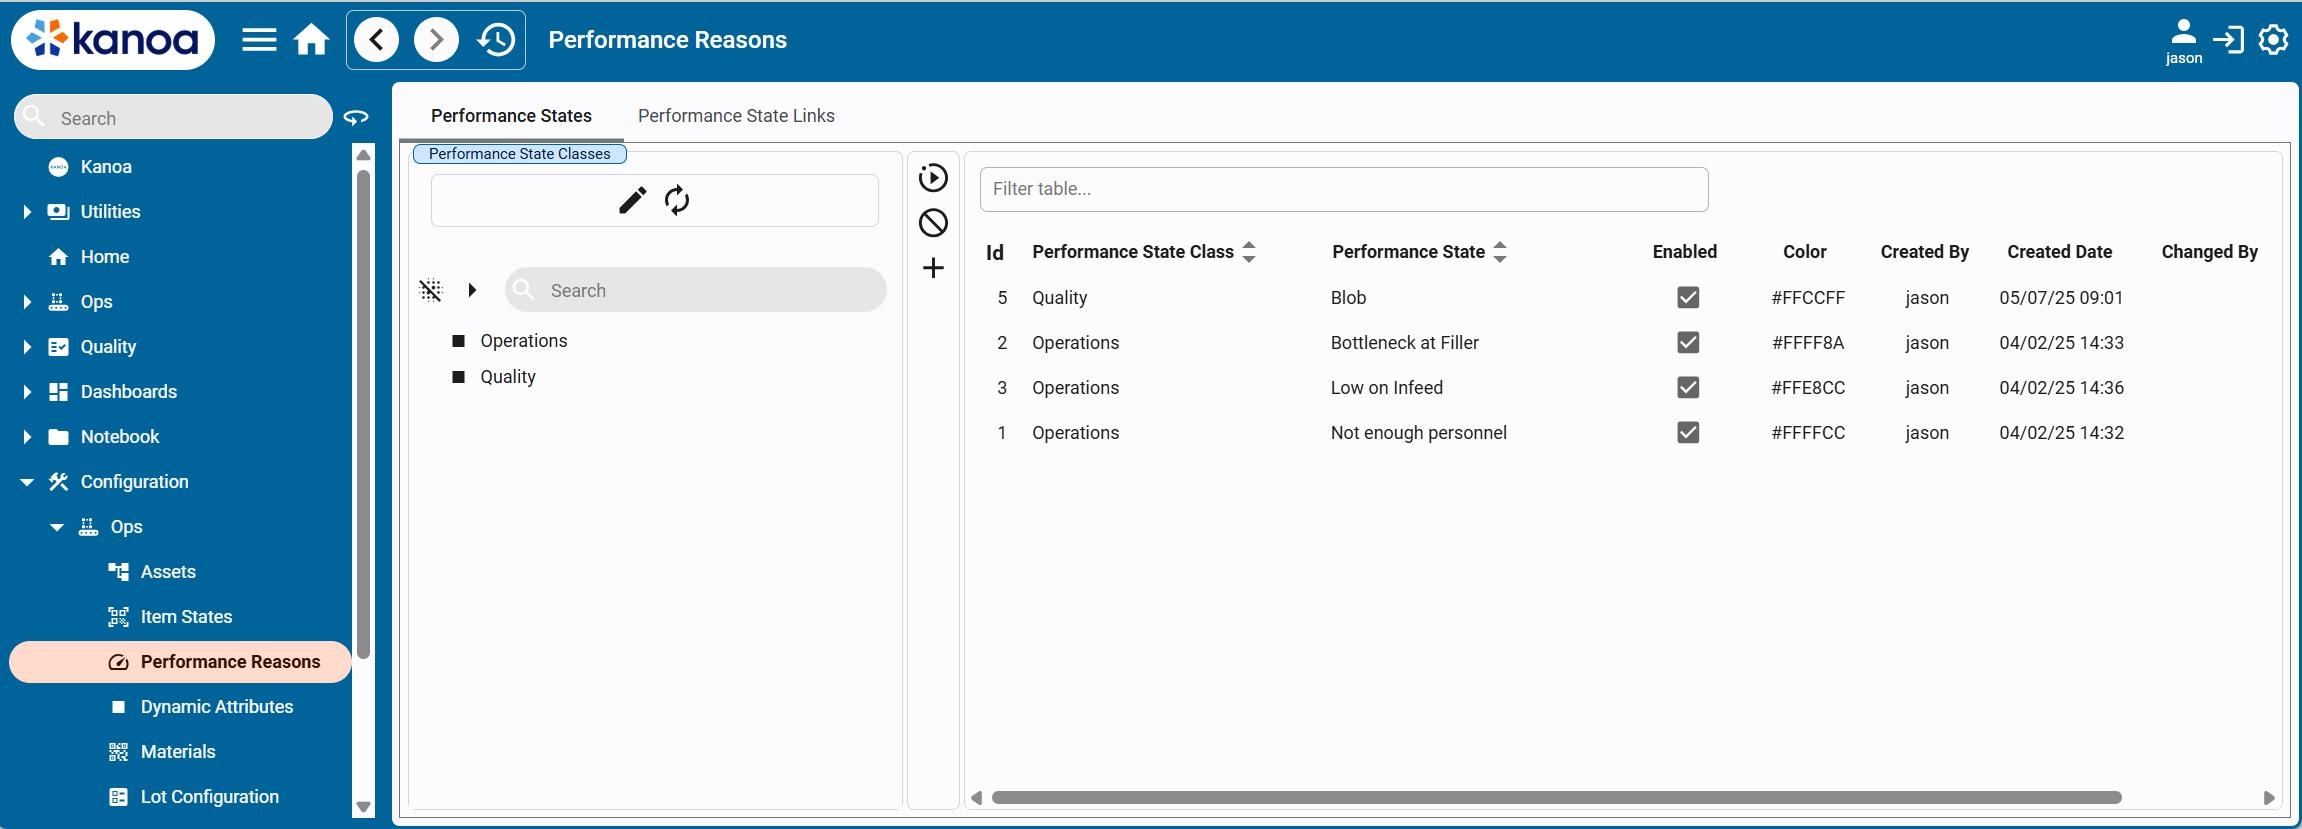
Use the configuration UI or system functions (like system.kanoa.performanceState.addPerformanceStateClass) to create classes and states, e.g., Material Feed → Low on Infeed. Link states to relevant assets and items.
Step 2: Configure Your Assets and Items
Ensure each OEE-enabled asset has a defined ideal (standard) rate. Link performance states within the asset configuration under the Performance States section.
Step 3: Enable Logging of Performance Events
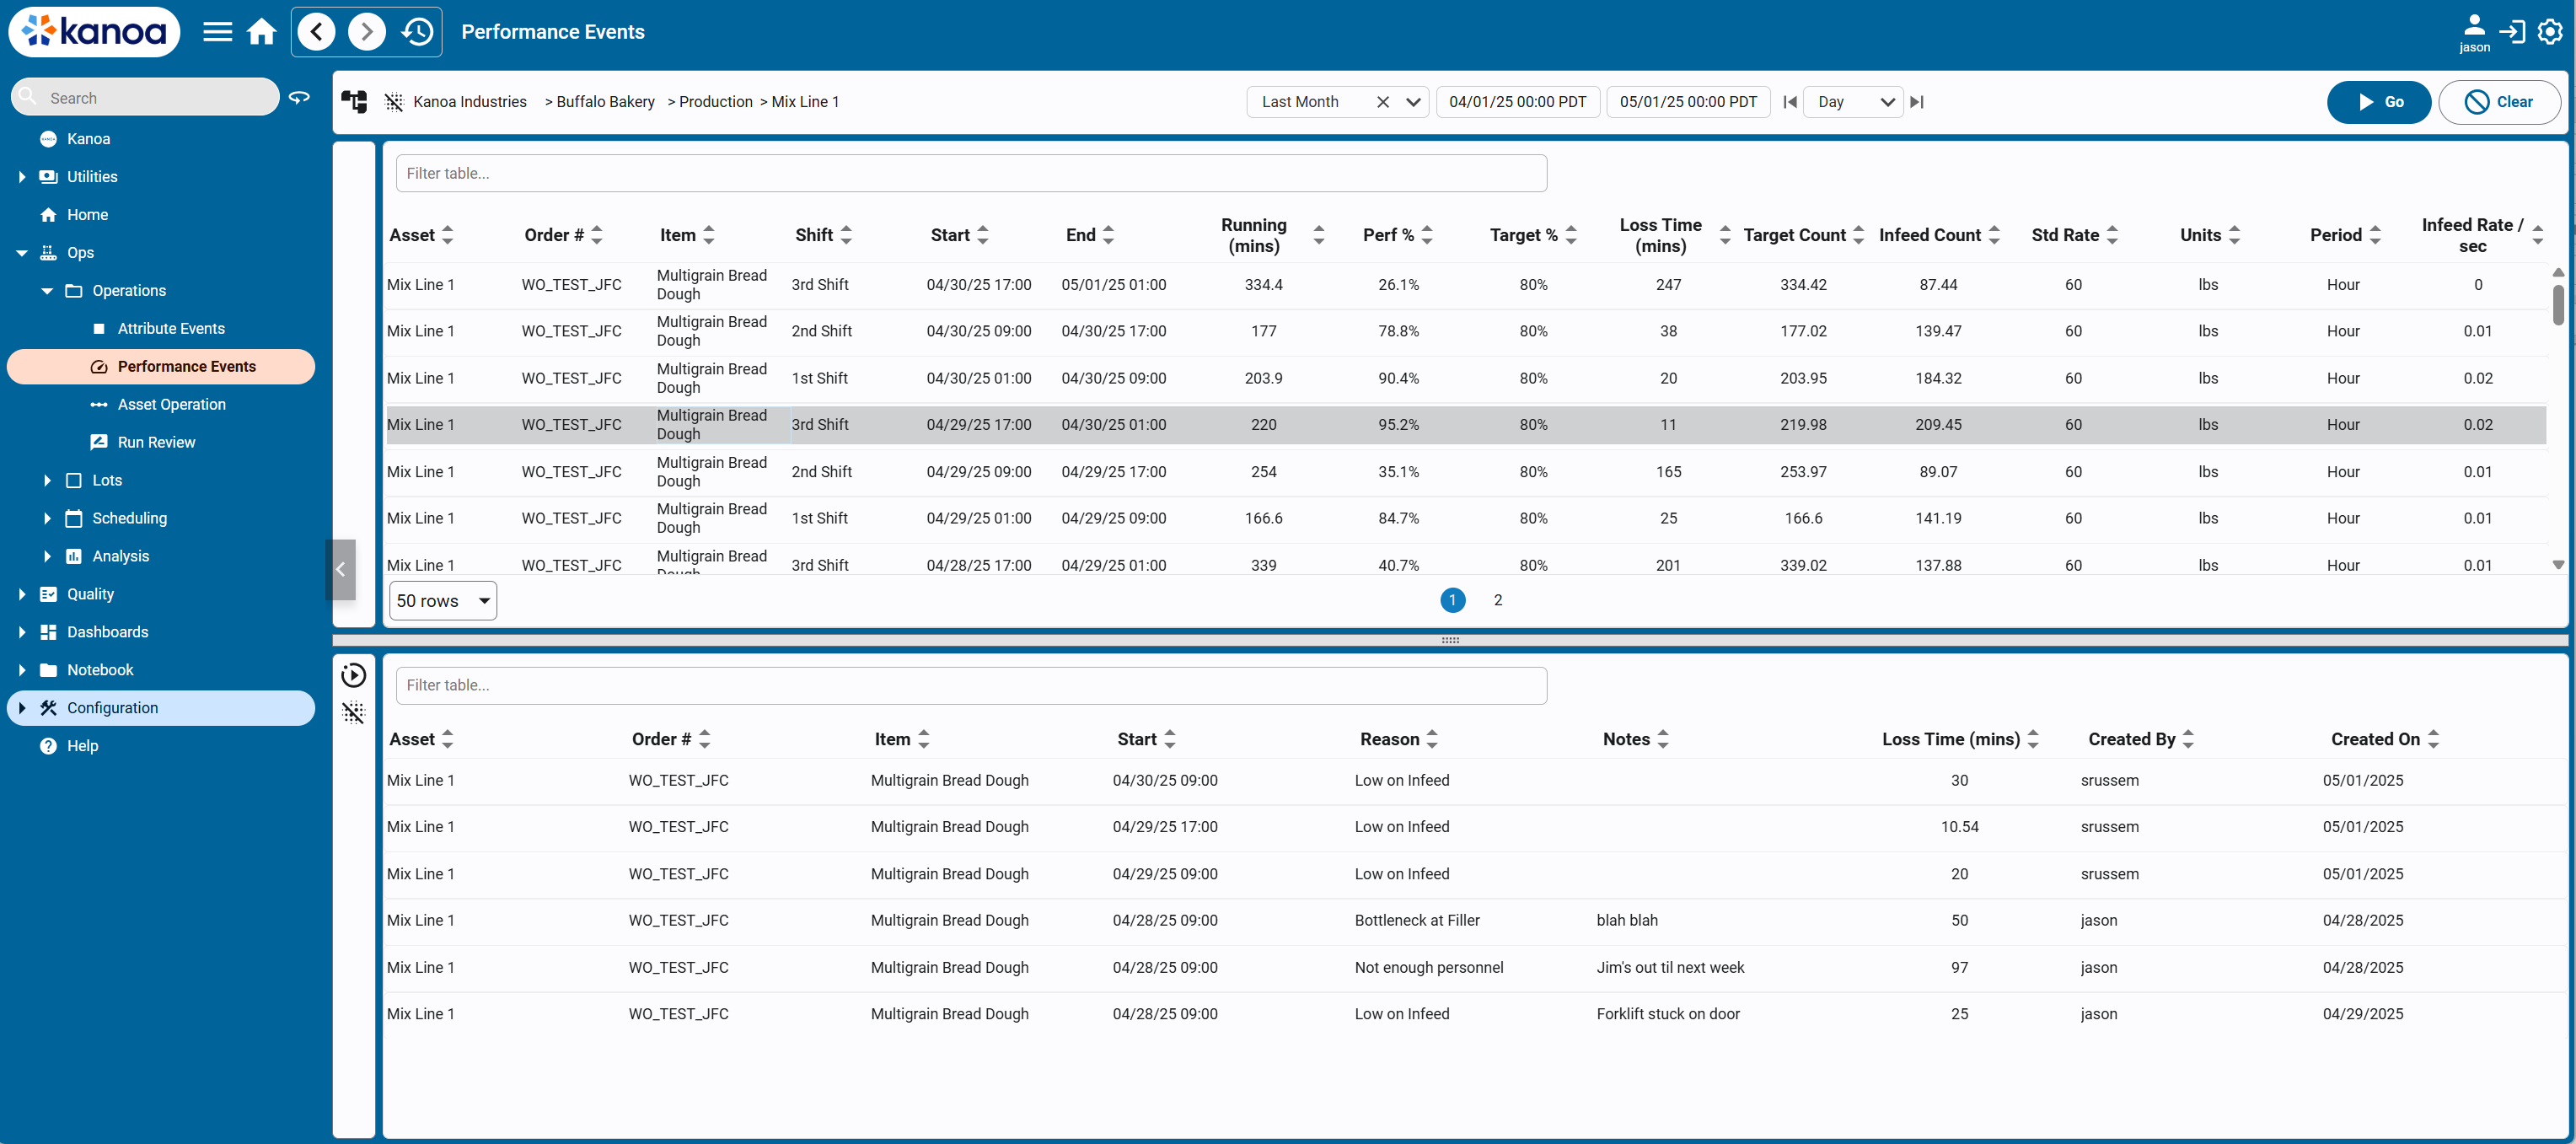
Operators can log events manually when slowdowns occur, noting start time, duration, and reason. Alternatively, call system.kanoa.event.addPerformanceEvent() from automation scripts to record events automatically.
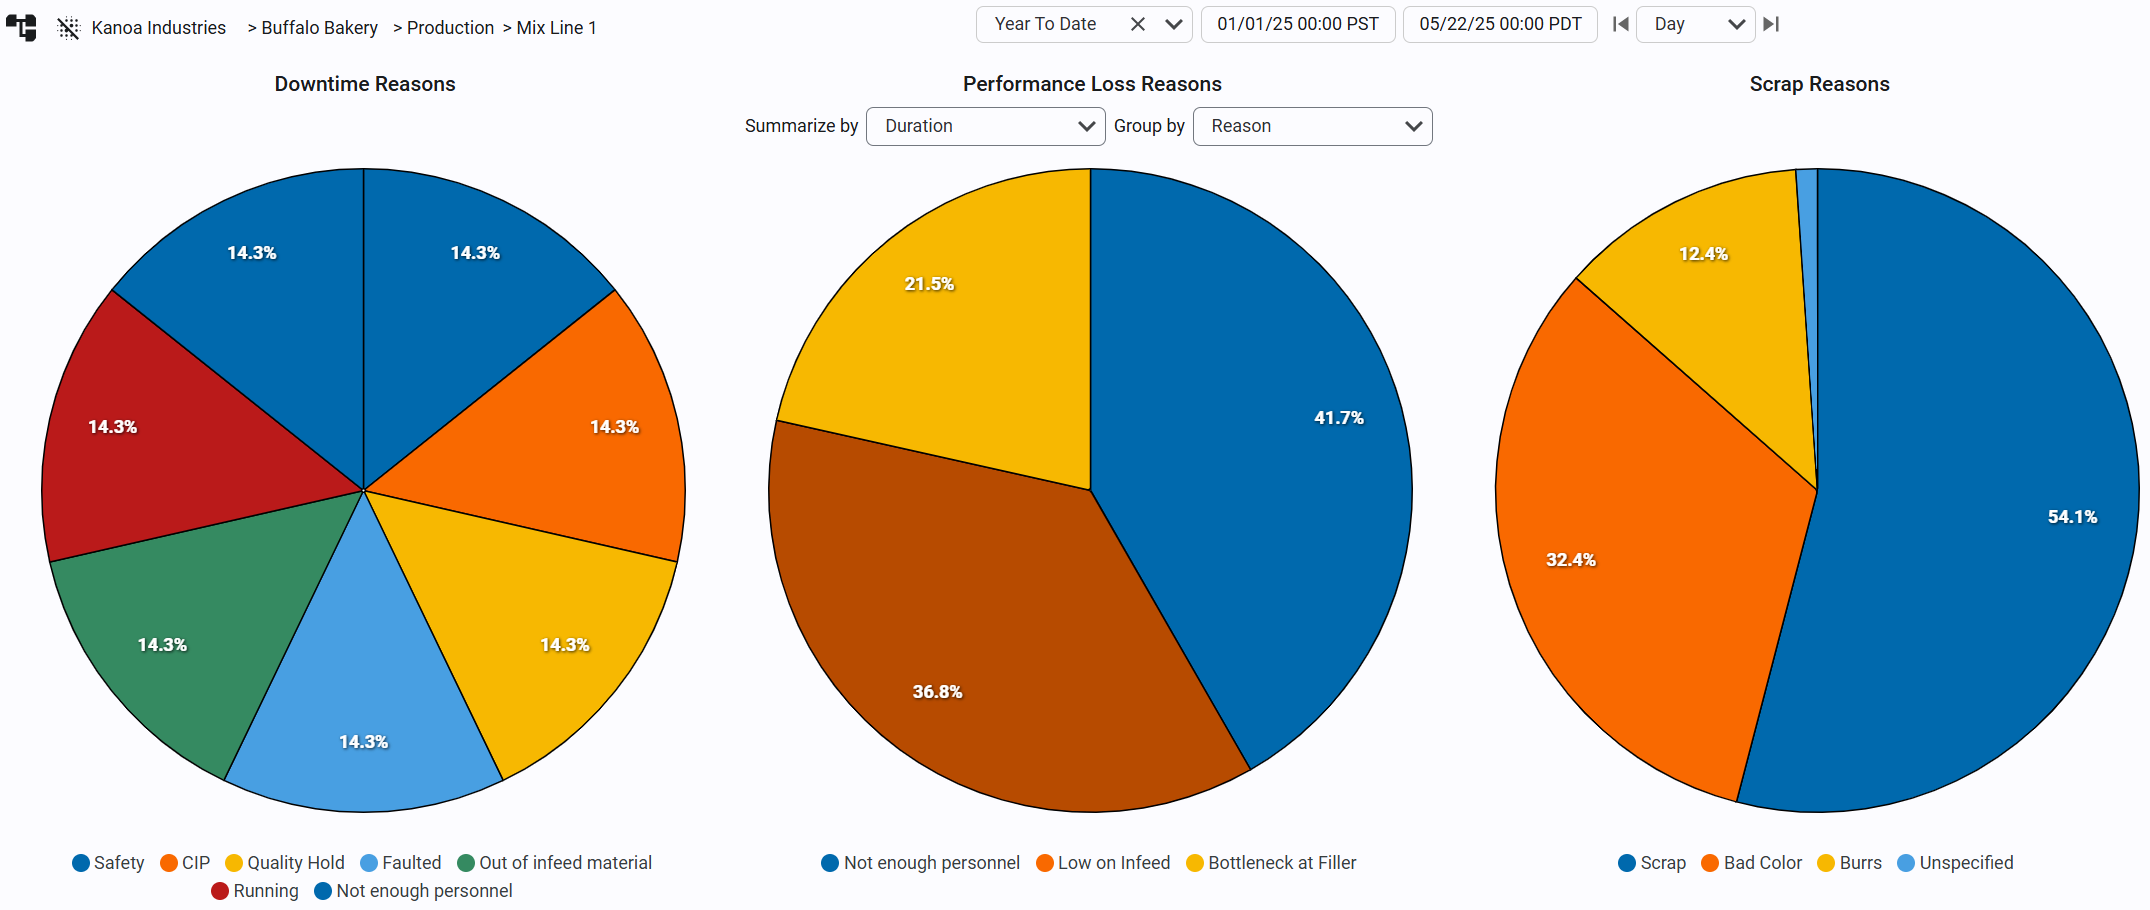
Step 4: Build Dashboards & Analytics

Leverage the built-in widgets:
performanceReasonBarChartperformanceReasonPieChartperformanceReasonTable
Filter by asset, date, or reason to spot top performance losses and track improvement trends.
Step 5: Embed into Continuous Improvement Routines
Add performance-reason summaries to daily reports. Use them in root-cause reviews to identify high-impact issues and measure progress (e.g., reducing “Tool Change Adjustment” losses from 250 to under 100 minutes per month).
Wrapping Up
In today’s manufacturing environment, where every minute of lost speed adds up, visibility into performance losses is crucial. Without structured data, your OEE score may show what happened — but not why.
With Performance Reason Coding in Kanoa Ops, every slowdown becomes an opportunity for insight — and every insight, an opportunity for improvement.
Because in the end, it’s not just about knowing your OEE score. It’s about knowing what to do with it.

Why You Should Be Thinking About Dev, Test, and Prod Environments for Your MES
Navigating the World of MQTT: The Backbone of IoT Communication

No Comments Yet
Let us know what you think