Simply collecting data is not beneficial unless it is analyzed. That's why Kanoa MES offers several methods to disseminate, dissect, and interpret manufacturing and machine data.
Applying the DIKW Model for Knowledge Management
 The DIKW (Data - Information - Knowledge - Wisdom) model emphasizes the importance of contextualizing data. Raw data from a PLC can often be meaningless or misleading. For example, a fault code of 'E-Stop pressed' on Line 3 for 2 hours could indicate routine maintenance rather than an actual production stoppage. Therefore, 'Applying Meaning' is essentially about adding context.

While a fault code such as 'machine faulted' can provide accurate availability metrics, it is challenging to use this data to prevent future occurrences without additional context. Effective improvement requires operators to accurately code downtime events so you can understand what it is you need to correct. Different problems require distinct solutions: Inventory shortages, lack of operations personnel, major mechanical faults, and simpler mechanical fixes are all downtime reasons with very different short- and long-term fixes.
The Evolution of Analytics
There has been significant evolution in how production data is analyzed to foster continuous improvement. While static PDF and paper reports were valuable at the time, a monthly emailed PDF with the latest KPIs doesn't satisfy the on-demand data and insights promised by Industry 4.0. Modern systems like Kanoa MES aim to provide instant access to metrics anytime, anywhere, whether from a desktop or mobile device. This access allows for deeper analysis to understand the root causes of production halts or cost increases.
Data Connectors
Kanoa MES is built on and for Inductive Automation's Ignition platform. Ignition provides effective components for visualizing production data, including the Apex Chart module from Travis Cox. However, there are many other analytics tools available, such as Tableau, Power BI, SSRS, Matlab, and MiniTab. Our goal with Kanoa MES was to ensure the data powering your analytics is fast, open, accessible, and easily shareable with other systems.
All the data powering the analytics you see in the Kanoa MES Accelerator Project come from calling functions that return data from SQL Stored Procedures and View Tables. This means that it's easy to share data with other teams and platforms, without having to create new endpoints or push and duplicate data to different databases; and certainly without the fear they may show entirely different results in other systems to what the MES shows.
Data by Design
Our database schema is designed following the first normal form pattern. This structure provides the smallest footprint by ensuring that no data is duplicated and that in itself guarantees data integrity by avoiding inconsistent data across raw and aggregate data tables.
All data is constructed using primary and foreign key relationships, that further ensures integrity by preventing orphaned records, and by linking records using integers, provides critically fast queries using built-in table indexes and binary tree search algorithms. In addition, we further optimized the database by tuning it against the most common long running queries, using the information gained to construct additional indexes to allow even faster record retrieval.
Denormalized Form Pattern design could potentially provide for even faster performance in some cases, but at the expense of data duplication by creating redundant data and increasing the database size. For us, the ease and importance of users being able to correct errant production data is paramount in our design, which is why we tried and ditched this method.
Out-of-the-Box Analytics
It's great for you to understand Kanoa's approach to data and analytics, and we hope this background helps you when you need to create custom reports. That being said, Kanoa MES comes with a number of analytical screens already provided. If you want to change how they look or pair them with different data, simply open up the Ignition designer and change them. They're all built with standard Ignition components or the add-on Apex chart module.
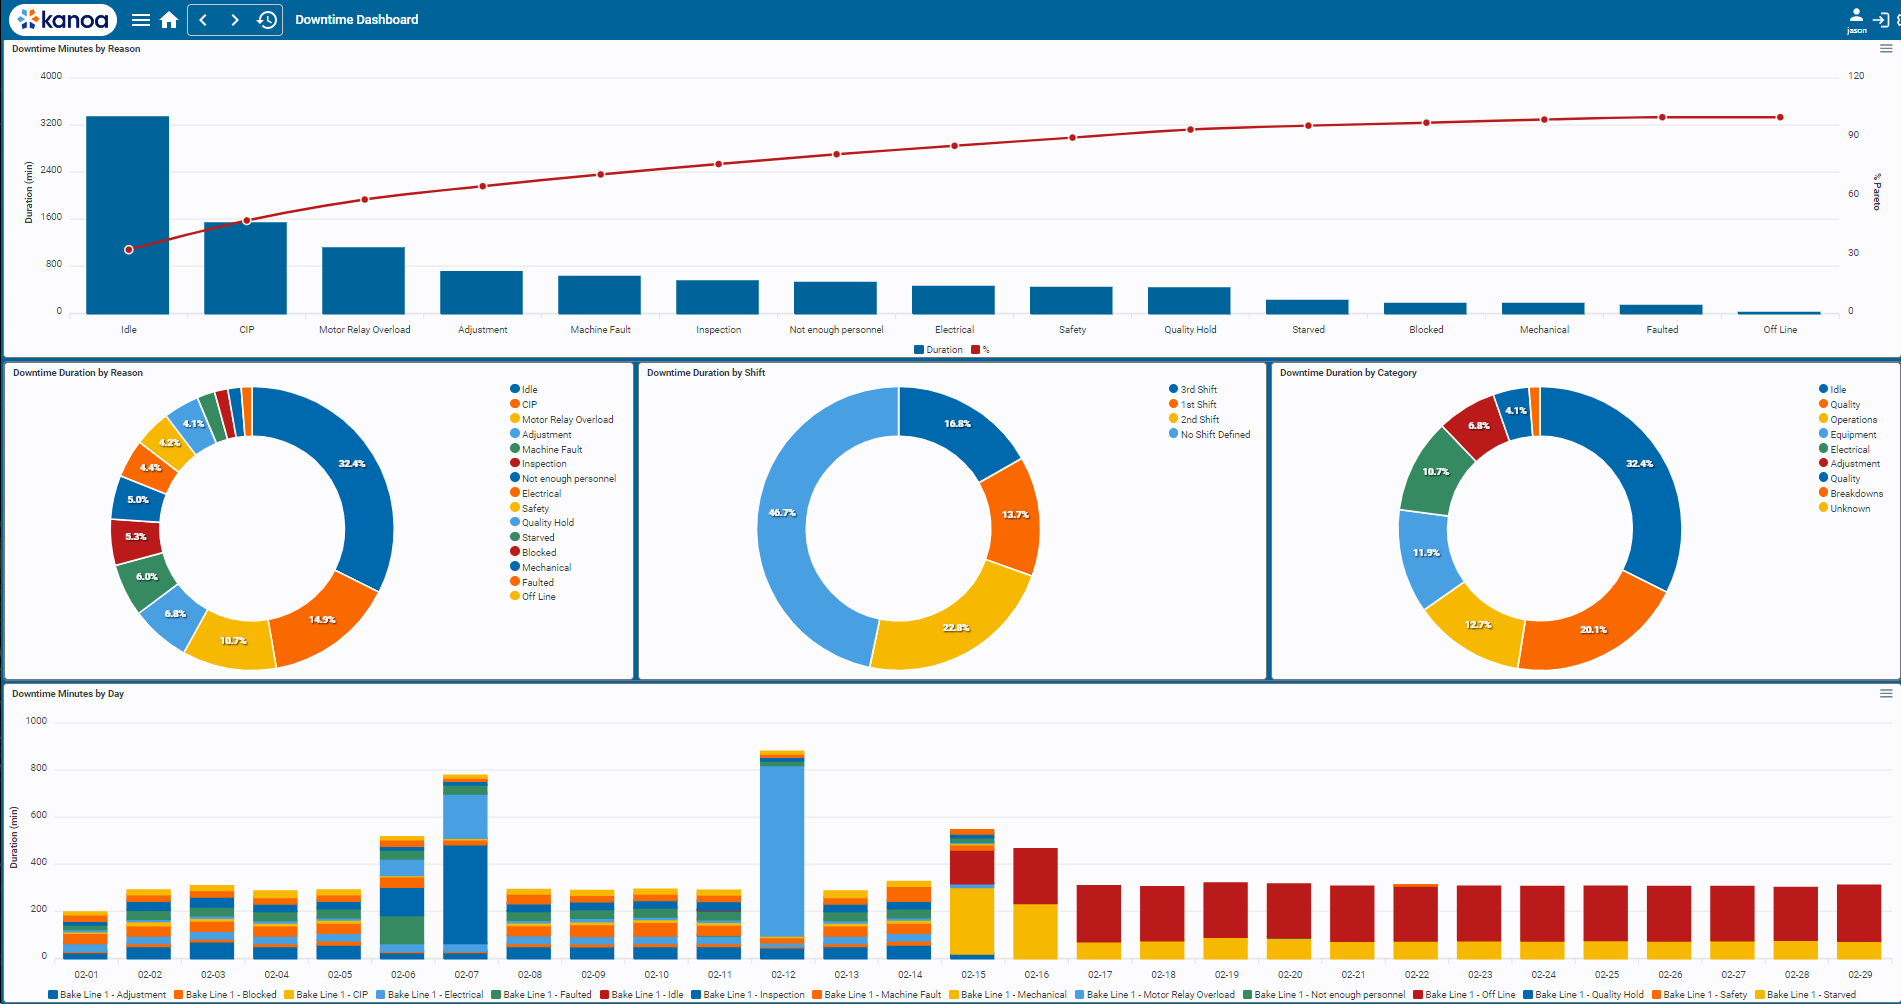
- Summary Dashboard
- Run Review
- OEE
- Downtime
- Reliability KPIs
- Production Counts
- Run Chart
- Operator Station Charts
Kanoa MES 1.2 Release Resources

Kanoa Announces CMMS Solution in Development for Kanoa MES - Sign up for Early Access

No Comments Yet
Let us know what you think