
Kanoa MES 1.16 Is Here: Tooling, Asset Run Analysis and More
By Sam Russem on Nov 16, 2026, 8:36:08 PM
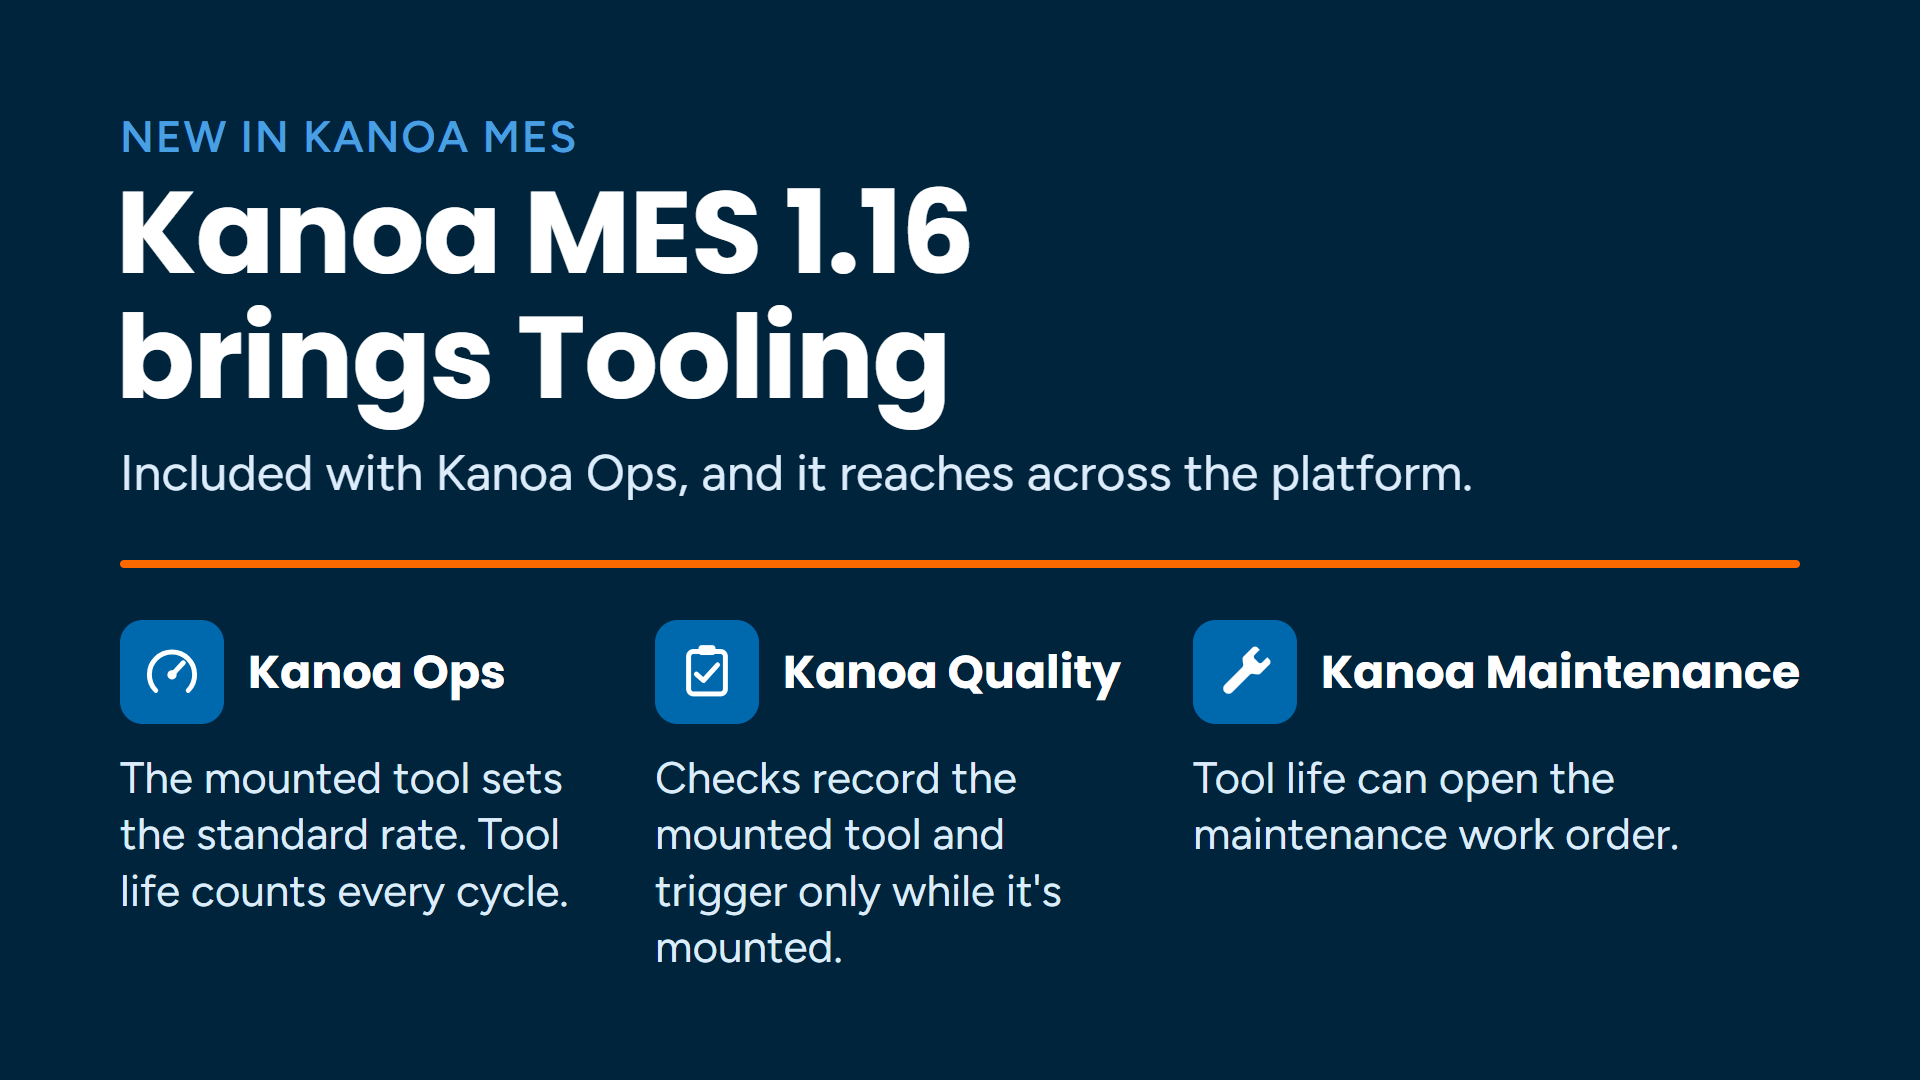
Kanoa MES 1.16 is now available. The headline is Tooling: the molds, dies, fixtures, gauges and other tools on your machines become part of Kanoa MES, and Tooling is included with Kanoa Ops at no extra cost.
Version 1.16 also brings Asset Run Analysis, which shows a machine's whole run on one screen. It records speed loss as it happens, adds Loss Analysis and new Quality triggers, brings big quality-of-life updates to Lot Manager, refreshes the tree and breadcrumb components, and hardens security. And it's the fastest Kanoa MES yet: in our stress test, 1.16 handled twice the production lines that 1.15.12 could on the same server.
Tooling, included with Kanoa Ops
If your machines run tools, the tool decides a lot: how many parts come off each cycle, how fast the machine should run, when the tool needs maintenance, and which quality checks apply. With 1.16, Kanoa MES knows which tool is mounted and puts it to work.
- Tools are assets. Molds, mold inserts, dies, jigs, fixtures, gauges, cutting tools, change parts and other tools live in the asset tree and are managed in Configuration > Ops > Tooling. Nine tool types are ready to use, and you can add your own.
- Positions and parts per cycle. Cavities, stations and pockets each say how many parts they make per cycle. Block a damaged cavity and the missing parts show up as a performance loss instead of disappearing.
- The mounted tool sets the rate. A tool's cycle rate on a machine, times its parts per cycle, becomes the run's standard rate, so OEE performance is measured against the tool that's actually running.
- Mounting from the Operator Station or from the machine's PLC tags, with mold bases and inserts, mount warnings, and optional fit rules for which machines a tool can go on.
- Tool life. Cycles and running time are counted against PM, refurbishment, lifetime and calibration limits, with statuses and alerts when a tool is due or over a limit.
- Required tooling and scheduling. Say which tools an item needs on a machine. Run Control warns before a run starts without them, and scheduled operations reserve their tools, with the scheduler flagging double bookings.
- Export and import. Move a tool's whole setup between gateways, with a preview before anything is saved.
Tooling reaches across the platform, too:
- With Kanoa Quality, checks record the tool that was mounted, and a check sheet linked to a tool triggers only while that tool is on the machine.
- With Kanoa Maintenance, work orders can be raised against tools, and a Tool Life condition creates a work order when a tool's PM, refurbishment or calibration limit reaches its warning level. Completing the work order resets the counter.
- The Event Notifications widget lists tools that are due for maintenance or over a limit.
New to Tooling? Getting Started with Tooling walks through one mold from start to finish, and a six-lesson Tooling course has been added to the Kanoa Ops training.
Asset Run Analysis: the whole run on one screen
How did the machine actually run today? Answering that used to mean looking at several screens. In 1.16, the new Asset Run Analysis dashboard on the Operator Station puts it all on one timeline: counts, schedule, downtime, speed loss, tooling, quality and scrap.
- Counts against target. Infeed, outfeed and waste build up as running totals against a dashed target line, so you can see at any point in the run whether the machine was ahead of target or behind it.
- Schedule against actual. What was scheduled sits right above what the machine actually ran, run by run and mode by mode, and the time spent in changeovers, maintenance and other modes is shaded on the chart.
- Downtime and speed loss show as events on the same timeline, so slow running sits next to the stops.
- Item and tool changes are marked where they happened.
- Quality checks, SPC alerts, maintenance work orders and scrap are marked where they happened too, including the hours with a lot of waste that has no reason. Checks and SPC alerts come with Kanoa Quality, and work orders with Kanoa Maintenance.
Beside the chart, a totals panel breaks the range down run by run, with each run's target, infeed, outfeed, waste and rates. It also shows the time by schedule, downtime, speed loss and mode, and the waste by scrap reason. For users with the right access, each section opens where you can act on it: the downtime table, the speed loss events, the quality checks or work orders, or the new Scrap editor, where waste recorded without a reason can be given one.
Drag across the chart to zoom in on a stretch of time. While the range includes now, the chart keeps itself up to date.
New installations use Asset Run Analysis as the Operator Station dashboard for every asset, and new OEE-enabled assets get it as their dashboard. The same chart is on the Production page and in the Production Counts dashboard widget. See Production Counts in the documentation.
Real-time speed loss
A machine that runs slow never stops, so the loss rarely gets a reason. In 1.16, Kanoa MES checks each OEE machine every minute. When it runs below its standard rate (by default, below 95% for 5 minutes), an automatic performance event opens and stays open until the rate recovers, the run changes or the machine stops.
Operators see it on a new speed loss card on the Operator Station and pick the reason from a tree of reasons. A standard set of speed loss reasons in seven classes (Equipment, Material, Process, Line Flow, People, Utilities and Tooling) is ready to use. The thresholds can be changed per asset, and new live OEE tags show the actual rate and the open event.
A new Operator Station info panel
The info panel is now a set of cards: Production, State, Speed loss, Tooling and Notifications. Each card opens its own popup, so an operator can change the run, set a state, code a speed loss or mount a tool from one place.
Loss Analysis
The Reliability KPIs screen is redesigned and renamed Loss Analysis. It shows where each asset's time went and what each loss cost, in minutes, with a drill-down by loss, asset and reason, and an events table you can export.
More Quality triggers
Check sheets can now be scheduled from more of what happens on the line:
- State Change: a check once an asset has been in a chosen state for a minimum time, for example after a line has been Blocked for 10 minutes.
- General Count: a check every n counts of a general counter.
- Infeed, Outfeed and Waste Count: these triggers now schedule a check every n counts.
- From Mode: a Mode Change trigger can also match the mode the asset is changing from, so a check can run on Changeover to Production but not on Maintenance to Production.
- Tools and items: checks tied to a tool or an item are scheduled only when they apply.
Version 1.16 also includes a large set of Kanoa Quality fixes, and the SPC trend chart now uses the same rule engine as the SPC functions.
Lot Manager updates in Kanoa Trace
- Add Lot Operation opens a popup with the selected lot as its first input. Click an operation in the trace to edit or delete it in the same popup.
- The Lot Editor shows the lot's stock. Changing the quantity records an Adjust lot operation, and changing the location records a Transfer.
- Save as Route turns a lot's trace into a new route. Double-click an operation to see all of its input and output lots, or flip the trace graph to read right to left. The trace graph layout is cleaner, too.
The fastest Kanoa MES yet
Version 1.16 does more with less. We stress-tested 1.16 against 1.15.12 on the same business laptop, running both the Ignition gateway and SQL Server, with the same week of history:
- Twice the production lines. 1.16 handled 1,000 lines counting every 10 seconds, 10,084 counts a minute on 1.66 logical processors. On the same laptop, 1.15.12 managed 5,191 counts a minute on 2.48.
- 76% fewer database queries at 500 lines, with database CPU down 71%, because counts are now written together every 30 seconds instead of one write per count. Screens still update on every count.
- Faster screens on long histories. Production by shift is 7× faster and the This Week summary 2.6× faster. With 20 operator screens open, gateway CPU is down a third and peak threads by two thirds.
- Native Java. Most Kanoa functions now run natively in Java, and live OEE tags replace the old tag timers and scripts, freeing up tag threads for your own work.
The full results are on the Stress Testing tab of the release notes.
Platform: components and security
- Tree and breadcrumb components: a new tree selector with search and Expand All, Collapse All and Clear buttons, which keeps its selection when it refreshes. Breadcrumbs now handle names that contain "/".
- Security hardening across the platform. We recommend upgrading.
- Fewer dependencies: Kanoa MES charts now use the built-in Kanoa ApexChart component, so the Embr Charts module is no longer needed, unless your own views use it.
- Gateway timers: Kanoa's timers now run as gateway timers, managed from a new Timers tab on the Kanoa gateway config page.
- Translations updated for all supported languages.
Before you upgrade
Version 1.16 changes how counts, tags and timers work, and changes or removes some functions and views. If your system has custom scripts, queries, views or UDTs, read Before You Upgrade in the complete release notes first. The upgrade steps are there too: back up the database and the gateway, install 1.16, then remove the BIJC Calendar and Embr Charts modules if none of your own views use them.
Kanoa MES 1.16 supports Ignition 8.1 (8.1.33 or later) and Ignition 8.3 (8.3.3 or later).
Available now
Download Kanoa MES 1.16 and try it on your own Ignition Gateway.
Want to see Tooling in action, or talk through what 1.16 means for your plant? Schedule a conversation with the Kanoa team.
No Comments Yet
Let us know what you think